Wondering if a Hixson rental can truly cash flow this year? You are not alone. Investors across Hamilton County want a clear, simple way to evaluate returns before writing an offer. This quick guide shows you how to run the math on cap rate and cash-on-cash, what typical ranges look like in suburban Tennessee markets like Hixson, and which local inputs to verify so your model mirrors reality. Let’s dive in.
Key ROI metrics you should know
Understanding a few simple formulas will help you compare properties quickly and avoid surprises later.
Net Operating Income (NOI)
- What it is: Your property’s income after vacancy and operating expenses, before any loan payments.
- Formula: NOI = Gross Potential Rent + Other Income − Vacancy Loss − Operating Expenses
- Why it matters: NOI is the foundation for cap rate and helps you compare deals.
Capitalization Rate (Cap Rate)
- What it is: The unlevered return based on current income and price.
- Formula: Cap Rate = NOI / Purchase Price
- Use it for: Quick comparisons across properties when ignoring financing.
Cash-on-Cash Return (CoC)
- What it is: Your annual pre-tax cash flow after loan payments divided by the cash you invested upfront.
- Formula: CoC = Annual Cash Flow After Debt Service / Total Cash Invested
- Use it for: Measuring your leveraged, near-term cash yield. Highly sensitive to interest rate, down payment, and closing costs.
Other quick screeners
- Gross Rent Multiplier (GRM): Purchase Price / Gross Annual Rent. Good for screening, but it ignores expenses and vacancy.
Quick example: replace with local inputs
The following example illustrates the workflow. These numbers are not Hixson averages. Replace them with verified local inputs from current comps and county data.
- Purchase price: 200,000
- Gross annual rent: 24,000
- Vacancy at 6 percent → Effective gross income = 22,560
- Operating expenses at 35 percent of EGI = 7,896
- NOI = 14,664
- Cap rate = 14,664 / 200,000 = 7.33 percent
- If 25 percent down: cash invested 50,000 + 4,000 closing = 54,000
- Annual debt service example = 10,800
- Annual cash flow = NOI − debt service = 3,864
- Cash-on-cash = 3,864 / 54,000 = 7.15 percent
Again, plug in your actual Hixson numbers for rent, vacancy, expenses, taxes, and financing.
What returns look like in Hixson-style markets
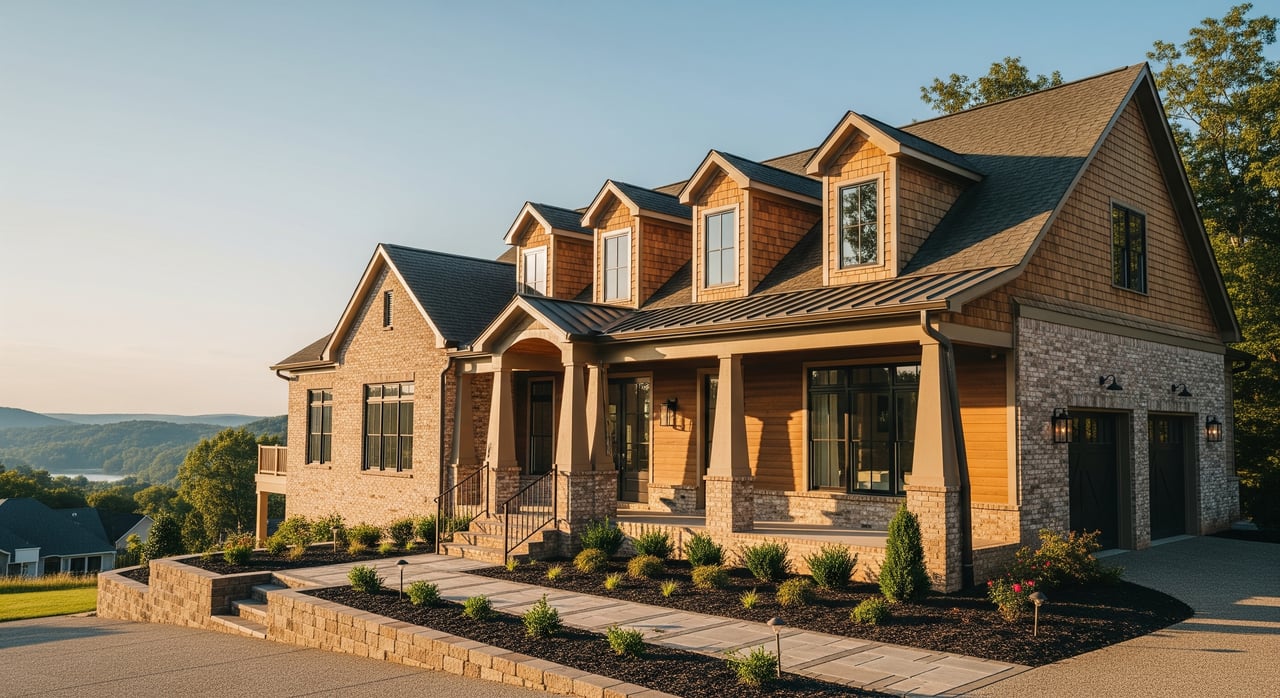
Hixson is an unincorporated community in Hamilton County on the north side of the Chattanooga metro. It has a mix of single-family homes, small multifamily, and some newer infill near major corridors. Actual returns move with interest rates, property condition, and demand. Use current MLS and assessor data when you model a specific address.
- Cap rate bands for stabilized properties in suburban Tennessee markets:
- Single-family rentals: roughly 5 to 8 percent
- Small multifamily 2 to 4 units: roughly 5 to 7.5 percent
- Small apartments 5 to 20 units: roughly 5 to 6.5 percent
- Distressed or value-add: often higher on purchase, then compress after renovations
- Cash-on-cash returns with typical investor financing:
- Many stabilized single-family rentals model at roughly 6 to 12 percent in year one with 20 to 25 percent down, depending on rate and costs
Use these as screening ranges only. Confirm with local comps and your lender before making offers.
Expenses and vacancy: realistic ranges
Your operating profile will drive most of the variance in returns. Start with conservative, local numbers.
- Vacancy and credit loss: 4 to 10 percent of gross potential rent. Use the lower end for well-located, renovated homes with strong demand and the higher end for older properties or slower seasons.
- Operating expense ratio (as a percent of gross income):
- Single-family rentals: 35 to 50 percent
- Small multifamily 2 to 4 units: 30 to 40 percent
- Small apartments 5 to 20 units: 25 to 35 percent
- Common line items to include:
- Property taxes: pull Hamilton County assessed values and current rates; taxes often land near 10 to 15 percent of gross income.
- Insurance: landlord policy with property and liability.
- Maintenance and repairs: 5 to 10 percent or more, depending on age and systems.
- Property management: about 8 to 12 percent of rent for single-family; lower for larger multifamily.
- Utilities: include any landlord-paid water, sewer, trash, or electric.
- HOA fees: treat as fixed if applicable.
- Reserves or capital expenditures: set aside 300 to 1,000 or more per unit per year, depending on age and roof or HVAC status.
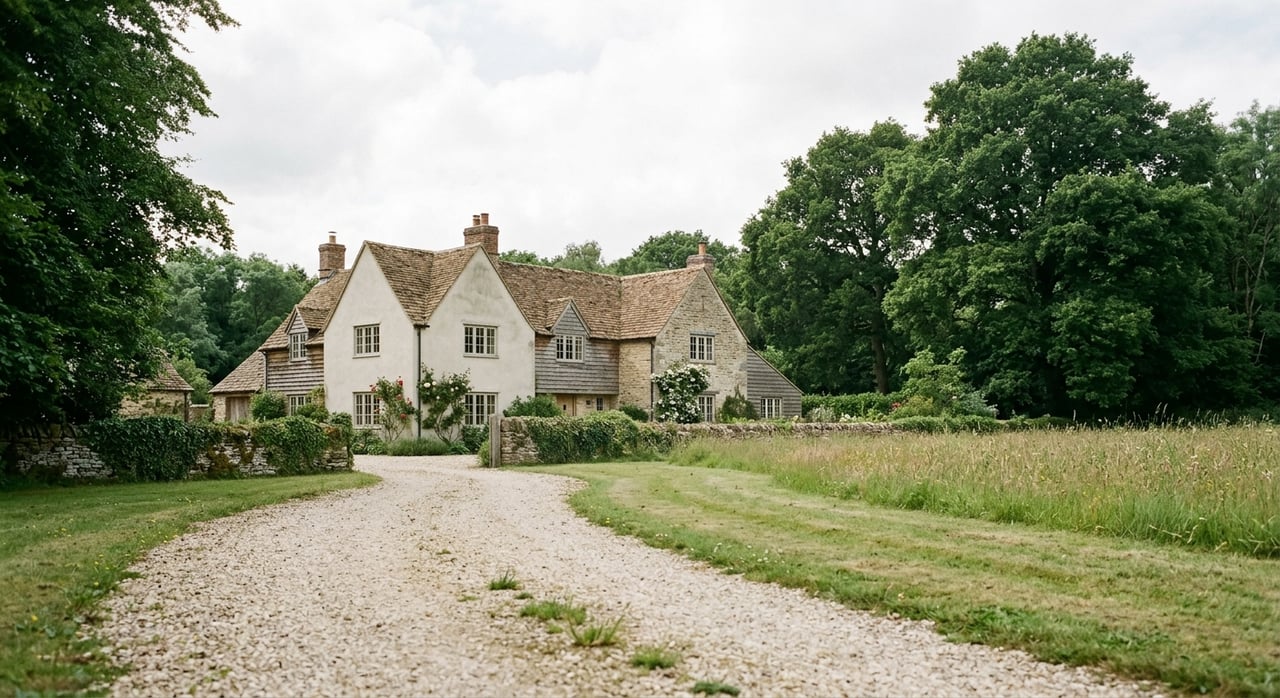
Property types in Hixson and ROI notes
Single-family rentals
- Predominant in Hixson and often appeal to longer-term tenants.
- Pros: Easy to finance with residential loans; broad renter pool.
- Considerations: Higher maintenance per unit and potentially higher turnover. Expense ratio tends to run higher than small multifamily.
Duplex, triplex, quad
- Scattered through suburban neighborhoods and attractive to small portfolio owners.
- Pros: Better revenue diversification across units and some scale on management and maintenance.
- Considerations: Still often financed as residential if under 5 units, which can be advantageous.
Small multifamily 5 to 20 units
- Less common inside strictly residential pockets but present near commercial corridors and closer to Chattanooga.
- Pros: Lower expense ratio per unit and more professional management.
- Considerations: May trade at lower cap rates if recently renovated or in strong demand areas.
Condos and townhomes with HOAs
- Pros: Lower exterior maintenance for you.
- Considerations: HOA fees and rules can affect NOI and flexibility, including possible rental caps or minimum lease lengths.
Leasing timelines and turnover
Marketing and timing matter. Budget some downtime between tenants.
- Time to lease:
- Well-priced, renovated single-family rentals: often 7 to 21 days
- Older units or homes needing updates: 21 to 45 days or more
- Seasonality: late spring and early summer often move faster; winter usually slows
- Screening and move-in:
- Application and screening: 2 to 7 days depending on your process
- Make-ready to move-in: 1 to 3 weeks if work is minor
- Turnover and make-ready costs: 500 to 4,000 per turn for single-family homes, depending on labor, materials, and condition.
Local cost drivers and risks to watch
Hixson performance is local. Build your model around the realities on the ground.
- Property taxes: Hamilton County reassessments and millage rates directly affect NOI. Always check current assessor data and look for exemptions that could change post-sale.
- HOA restrictions: Rental caps, minimum lease terms, or special assessments can reduce flexibility and income.
- Floodplain or environmental factors: Lakeshore or creek-adjacent homes may have higher insurance or mitigation costs.
- Supply changes: New subdivisions or multifamily deliveries near major corridors can pressure rents and lease-up times.
- School zones and commute corridors: These can influence tenant demand in suburban markets. Use neutral, factual data when comparing locations.
- Landlord-tenant rules: Tennessee law is largely state-level. Know the process for deposits, habitability, and enforcement timelines.
How to run your numbers like a pro
Use a simple one-page analyzer so you can compare addresses in minutes. Keep inputs on top, outputs below.
- Inputs to include:
- Purchase price
- Monthly or per-unit rent and other income such as pet fees or parking
- Vacancy percentage
- Annual expenses by line item: taxes, insurance, management, maintenance, utilities, HOA, legal or accounting, advertising
- Annual capital reserve
- Loan terms if using debt: loan amount, interest rate, amortization, annual debt service
- One-time costs: closing costs, initial repairs, and required reserves
- Outputs to review:
- Effective Gross Income, Operating Expenses, and NOI
- Cap Rate, Annual Debt Service, Annual Cash Flow
- Total Cash Invested and Cash-on-Cash Return
- GRM for a quick screen
If you would like a ready-to-use spreadsheet with a pre-filled example and editable fields, ask for the one-page analyzer. It includes a simple sensitivity view so you can see how rent or vacancy shifts change cap rate and cash-on-cash.
Checklist: verify these Hixson inputs first
- 6 to 12 active rental listings and 6 to 12 recent lease comps for similar beds, baths, and condition within Hixson or nearby neighborhoods
- Hamilton County assessed value and current property tax rates for the subject and comps
- HOA fees and any rental rules or caps
- Recent maintenance history, age of roof and HVAC, and expected near-term repairs
- A current lender quote with estimated rate, down payment, closing costs, and required reserves
When to use cap rate vs cash-on-cash
- Use cap rate when you want to compare properties on an unlevered basis, or when financing details are still uncertain.
- Use cash-on-cash when you have defined loan terms and want to understand short-term cash yield on your equity.
- Review both before you offer. Cap rate helps you price risk and income. Cash-on-cash shows how your financing choices affect results in year one.
Bringing it together
Hixson offers a practical mix of single-family and small multifamily options, but the right buy depends on verified rents, realistic expenses, and a clear view of vacancy and turnover. Start with the simple formulas in this guide, plug in current Hamilton County taxes and local comps, and test different financing scenarios before you write an offer. If you want a second set of eyes, request the one-page analyzer and a quick walk-through of your assumptions.
Ready to model a specific Hixson address or sanity-check your numbers? Reach out to Marcus Holt for current comps, a tailored ROI review, and a calm, financial-minded plan for your next step.
FAQs
What is a good cap rate for Hixson rentals?
- In suburban Tennessee markets, stabilized properties often trade in the roughly 5 to 8 percent range depending on type, condition, and demand; verify with current comps before offering.
How fast do single-family homes rent in Hixson?
- Well-priced, renovated homes often lease in 7 to 21 days, while older properties or homes needing updates can take 21 to 45 days or more.
How much should I budget for repairs and reserves?
- A starting point is 300 to 1,000 or more per unit per year, plus 5 to 10 percent of rent for routine maintenance depending on the age and systems.
What vacancy rate should I use in my model?
- Many investors use 4 to 10 percent depending on location, property condition, and season; aim for the lower end on renovated homes with strong demand and the higher end for older or slower-to-lease properties.
Cap rate vs cash-on-cash: which should I rely on?
- Use cap rate to compare unlevered property yields and cash-on-cash to evaluate your leveraged cash flow based on your specific loan terms and total cash invested.